Blogs
Data Modeling and Star Schema: A Practical Guide for Forward Deployed Engineers
Data Modeling and Star Schema: A Practical Guide for Forward Deployed Engineers
By
R&D, FDE Academy
October 16, 2026

Data modeling is the practice of defining the tables, columns, keys and relationships that represent a business, so that queries return consistent answers. It sits between raw source data and anything that consumes it: reports, metrics, machine learning features and retrieval systems.
Most confusion on customer projects comes from jumping to table design: people argue about column names before agreeing what an order is.
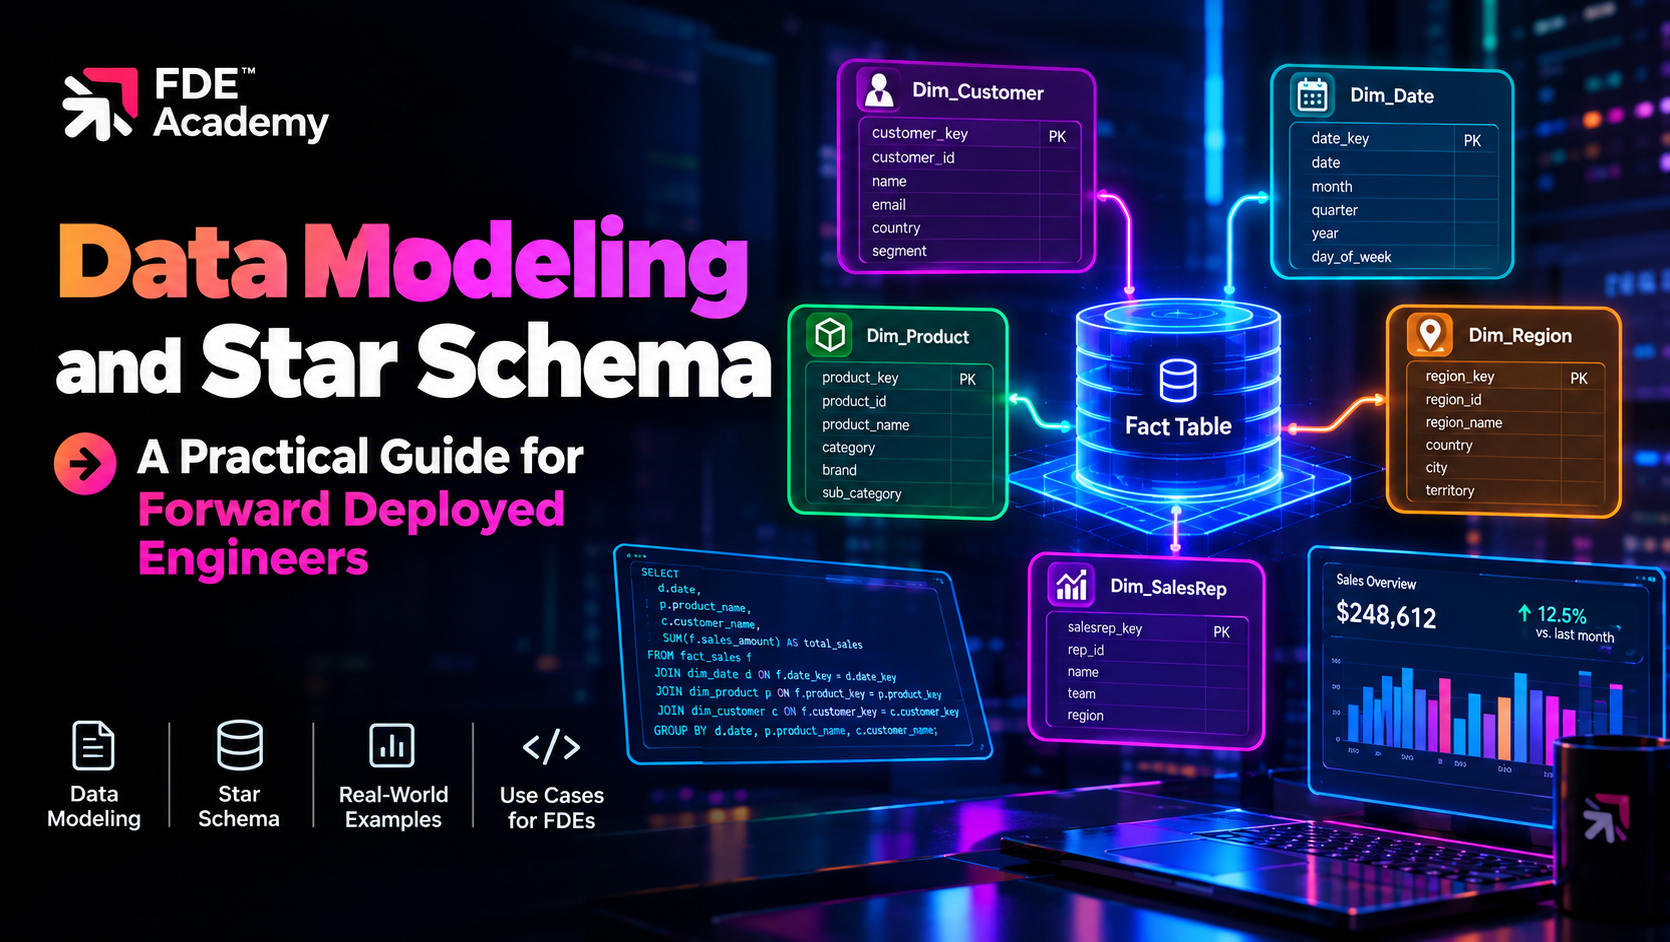
A star schema is a data model with one central fact table linked to several dimension tables. Drawn on a whiteboard, the fact table sits in the middle and the dimensions radiate outward, which is where the name comes from.
Microsoft Learn describes the split plainly: dimension tables describe business entities, the things you model, and enable filtering and grouping, while fact tables store observations or events and enable summarisation. Every report visual is effectively a query that filters, groups and summarises, so a model with that shape fits how analytics is asked for.
Ralph Kimball introduced dimensional modeling to the data warehouse industry in 1996 in The Data Warehouse Toolkit, according to the Kimball Group, and its vocabulary is still the common language of analytics engineering.
The distinction is simple to state and easy to blur in practice.
Per Microsoft's guidance, the "one" side of a relationship is a dimension and the "many" side is a fact table. Do not mix both roles in one table; a table holding order amounts and customer addresses will eventually double-count.
Kimball's technique list names several fact table types: transaction (one row per event), periodic snapshot (state at regular intervals, such as daily balances), accumulating snapshot (a process moving through stages) and factless (an event with no numeric measure).
The grain is what one row in the fact table represents. It is the most important decision in the model, and the one most often left implicit.
"One row per order" and "one row per order line" are different grains. Total order value lives naturally at the first; quantity of each product lives at the second. An order-level shipping fee repeated on every line row will be summed once per line and overstate revenue.
State the grain as a sentence before you touch a column: "One row per product per order." Test every column against it. If a column does not fit that grain, it belongs elsewhere.
The Kimball Group lists a four-step dimensional design process among its fundamental concepts. In plain terms:
The order matters. Starting from the requested dashboard gives you a table that answers that dashboard only. Starting from the process and grain gives you a model that survives the next five questions.
This is a hypothetical example to show the method; the retailer and its data are invented.
An FDE joins a mid-sized retailer. Orders come from a web shop, an app and store point-of-sale systems. Finance, marketing and operations each report "sales" and get different numbers. The client wants one trusted sales model, and later a churn model.
Step 1: Process. Retail sales.
Step 2: Grain. One row per product per order. The team agrees this in a workshop, and writes it at the top of the design document.
Step 3: Dimensions. Date, customer, product, store or channel, and promotion.
Step 4: Facts. Quantity, unit price, discount amount, and net line amount.
The physical design, in simplified SQL, looks like this:
sql
CREATE TABLE fact_sales (
date_key INT,
customer_key INT,
product_key INT,
channel_key INT,
order_number VARCHAR, -- degenerate dimension
quantity INT,
gross_amount DECIMAL(12,2),
discount_amount DECIMAL(12,2),
net_amount DECIMAL(12,2)
);
The order number stays on the fact table because it identifies the order but has no attributes of its own; Kimball calls this a degenerate dimension. The amount columns are additive, so they can be safely summed across any dimension.
Once all three teams query the same fact_sales through the same dimensions, the three versions of "sales" collapse into one, or the remaining differences become explicit business rules rather than accidents of SQL.
Dimension tables usually carry a surrogate key, a meaningless integer generated by the warehouse, rather than the source system's identifier. Kimball lists this as a basic dimension practice, and Microsoft recommends one when a dimension lacks a unique column. It insulates the model from source systems that reuse or merge IDs.
It also makes history possible. Customers move cities and products change categories. When an attribute changes, what happens to old facts?
Kimball names a family of answers, the slowly changing dimension (SCD) techniques, Type 0 to Type 7. Two matter most:
Ask what the business needs. If a customer moves from Pune to Mumbai, should last year's sales still count as Pune? For regional revenue the answer is usually yes, so use Type 2. For correcting a misspelt name, overwrite. Do not default every column to Type 2; it multiplies rows and complicates joins.
A snowflake schema normalises the dimensions into further tables. Product links to subcategory, which links to category. A "one big table" or wide-table design flattens everything into a single table per process.
Microsoft's guidance is direct on this. It says the benefits of a single model table generally outweigh the benefits of multiple model tables, and lists the costs of snowflaking: more tables to load, longer filter chains, a less intuitive field list, and hierarchies that cannot span tables.
The pragmatic approach is a star as the governed core, with wide tables built from it for specific consumers.
Conformed dimensions are dimensions shared across multiple fact tables with the same meaning. Kimball lists them under "integration". If dim_customer is identical for sales, support tickets and web sessions, you can answer cross-process questions such as "do customers with more tickets buy less?" without reconciling definitions each time.
Role-playing dimensions appear when one dimension relates to a fact in several ways. An order has an order date, a ship date and a delivery date, all pointing at the same date table. Microsoft notes that only one relationship between two tables can be active in Power BI, so the common approach is a separate date table per role. The price is some small duplicated tables. Use self-describing column names such as Ship Year. Always build a proper date dimension; Microsoft calls it the most consistent table you will find in a star schema.
Modeling is not an old warehouse topic that AI replaced. In deployment work it matters more.
Pipelines, covered in our guide to AI data pipelines for messy enterprise data, get data into shape. Modeling decides what shape it should be in. Why AI projects fail often traces back to this layer: teams build the model before anyone agreed what the numbers mean. Definitions, lineage and access are governance questions too; see AI governance for forward deployed engineers.
Platforms differ in vocabulary. Palantir Foundry, for example, models objects and links in an ontology rather than a classic star. The discipline is the same: name the entities, fix keys and relationships, and agree definitions first.
Learn the vocabulary, then practise: take any operational export, declare a grain, and build a fact table and three dimensions. Answer the same question in SQL against the raw data and against your star, and compare the effort.
On the job, this fits into the FDE project lifecycle during discovery and early build, when you learn how the customer's business actually runs. It is one of the technical skills an FDE needs, alongside SQL, Python and system design, and it sits comfortably within the wider FDE tech stack. Data engineers get a head start, as described in data engineer to forward deployed engineer. Comparing paths? Read forward deployed engineer vs data scientist and how FDEs help enterprises deploy AI.
TL;DR:
Data modeling is deciding how data is organised so people and systems can ask questions of it reliably. A star schema is the most widely used way to do that for analytics: one central fact table of events or measurements, surrounded by dimension tables that describe who, what, where and when. Declare the grain first, keep facts and dimensions separate, handle history deliberately, and prefer a star to a snowflake unless you have a reason. The same model then feeds dashboards, metrics and AI features with one set of definitions.
A star schema organises data around one central fact table of events or measurements, linked to dimension tables that describe the context. Queries filter and group by the dimensions and summarise the facts.
A fact table stores events or measurements and is used for summarising. A dimension table stores descriptive attributes of an entity such as a customer or product and is used for filtering and grouping.
The grain is what one row of the fact table represents, for example "one row per product per order". Declaring it first prevents double counting and keeps every column consistent with the row.
For most analytics, a star schema is the better default: fewer joins and easier to understand. A snowflake saves some storage, but Microsoft's guidance notes the costs in extra tables, longer filter chains and a harder-to-use model.
Decide per attribute. Use Type 1 to overwrite values when history does not matter, such as fixing a typo. Use Type 2 to add a new dimension row when past facts must stay tied to the old value, such as a customer's region.
AI features and assistants depend on consistent definitions, a known grain and traceable data. A good model gives dashboards, metrics and ML features one source of truth.
The world is hiring - and this Academy prepares you for it.